Leranis Construction Technologies
An analysis pipeline that goes from the architectural DWG drawing to the material bill of quantities.
Applied on a real project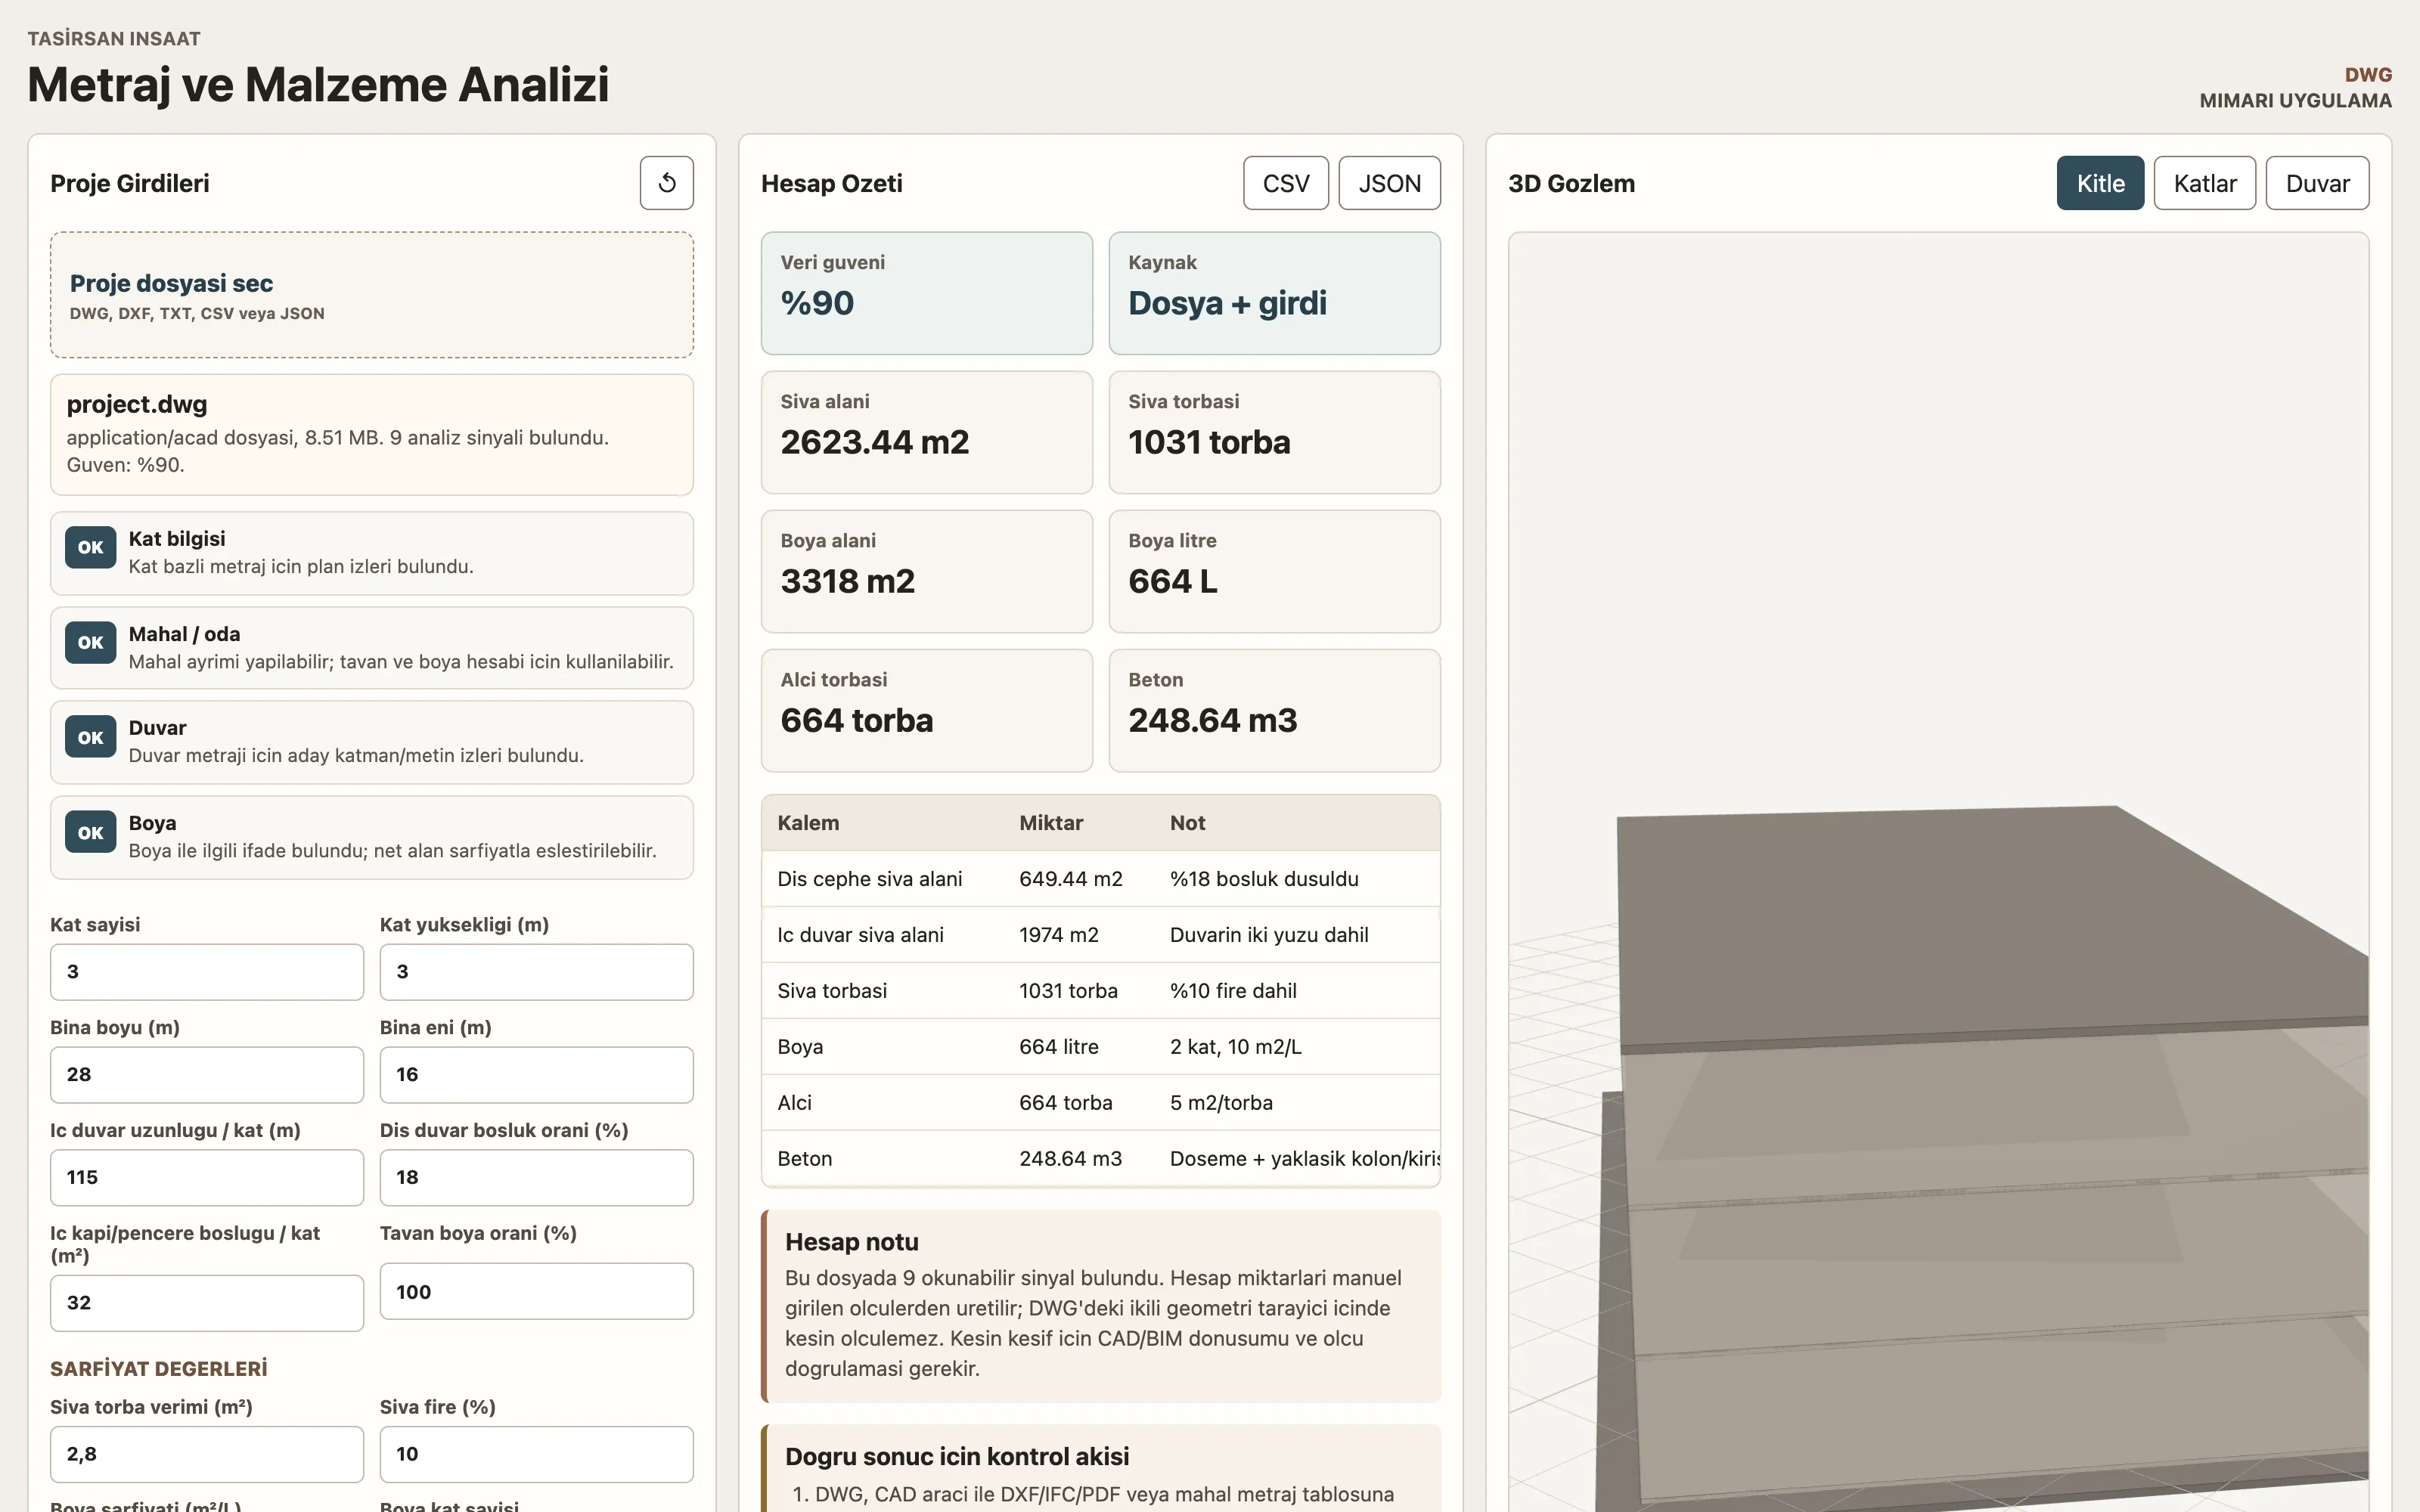
01 — Context
Taşırsan İnşaat had an 8-level, 12,084 m² student dormitory and administrative building project ahead of it, and a single source in hand: an 8.5 MB architectural construction DWG. The procurement plan needed a rough quantity take-off: how many bags of plaster, how many litres of paint, how many cubic metres of concrete? The drawing had floor plans and legends, but no clean, verifiable quantity table; a hand-calculated bill of quantities would have taken days.
02 — Problem
A drawing, but no quantities.
Bill of quantities by hand.
Procurement waiting for answers.
03 — Approach
Our approach for Leranis Construction Technologies
First we let the file itself speak: we analysed the DWG’s binary structure directly and scanned its format signature (AC1032), producer traces and every readable layer and legend text. Floor labels, room names, door and window items and material notes were extracted one by one. The analysis gave an honest result: the file contains no verifiable numerical quantities — and we wrote that on the first page of the report.
That finding shaped the architecture of the solution. Rather than guessing what could not be measured, we bound the calculation to rules: the signals read from the drawing and the manually entered measurements (number of floors, building dimensions, wall density, consumption values) meet in a single parametric calculation engine; the formula and basis of every result are visible.
“We read what the drawing said, and bound what it didn’t say to rules.”
04 — Solution
The solution we built
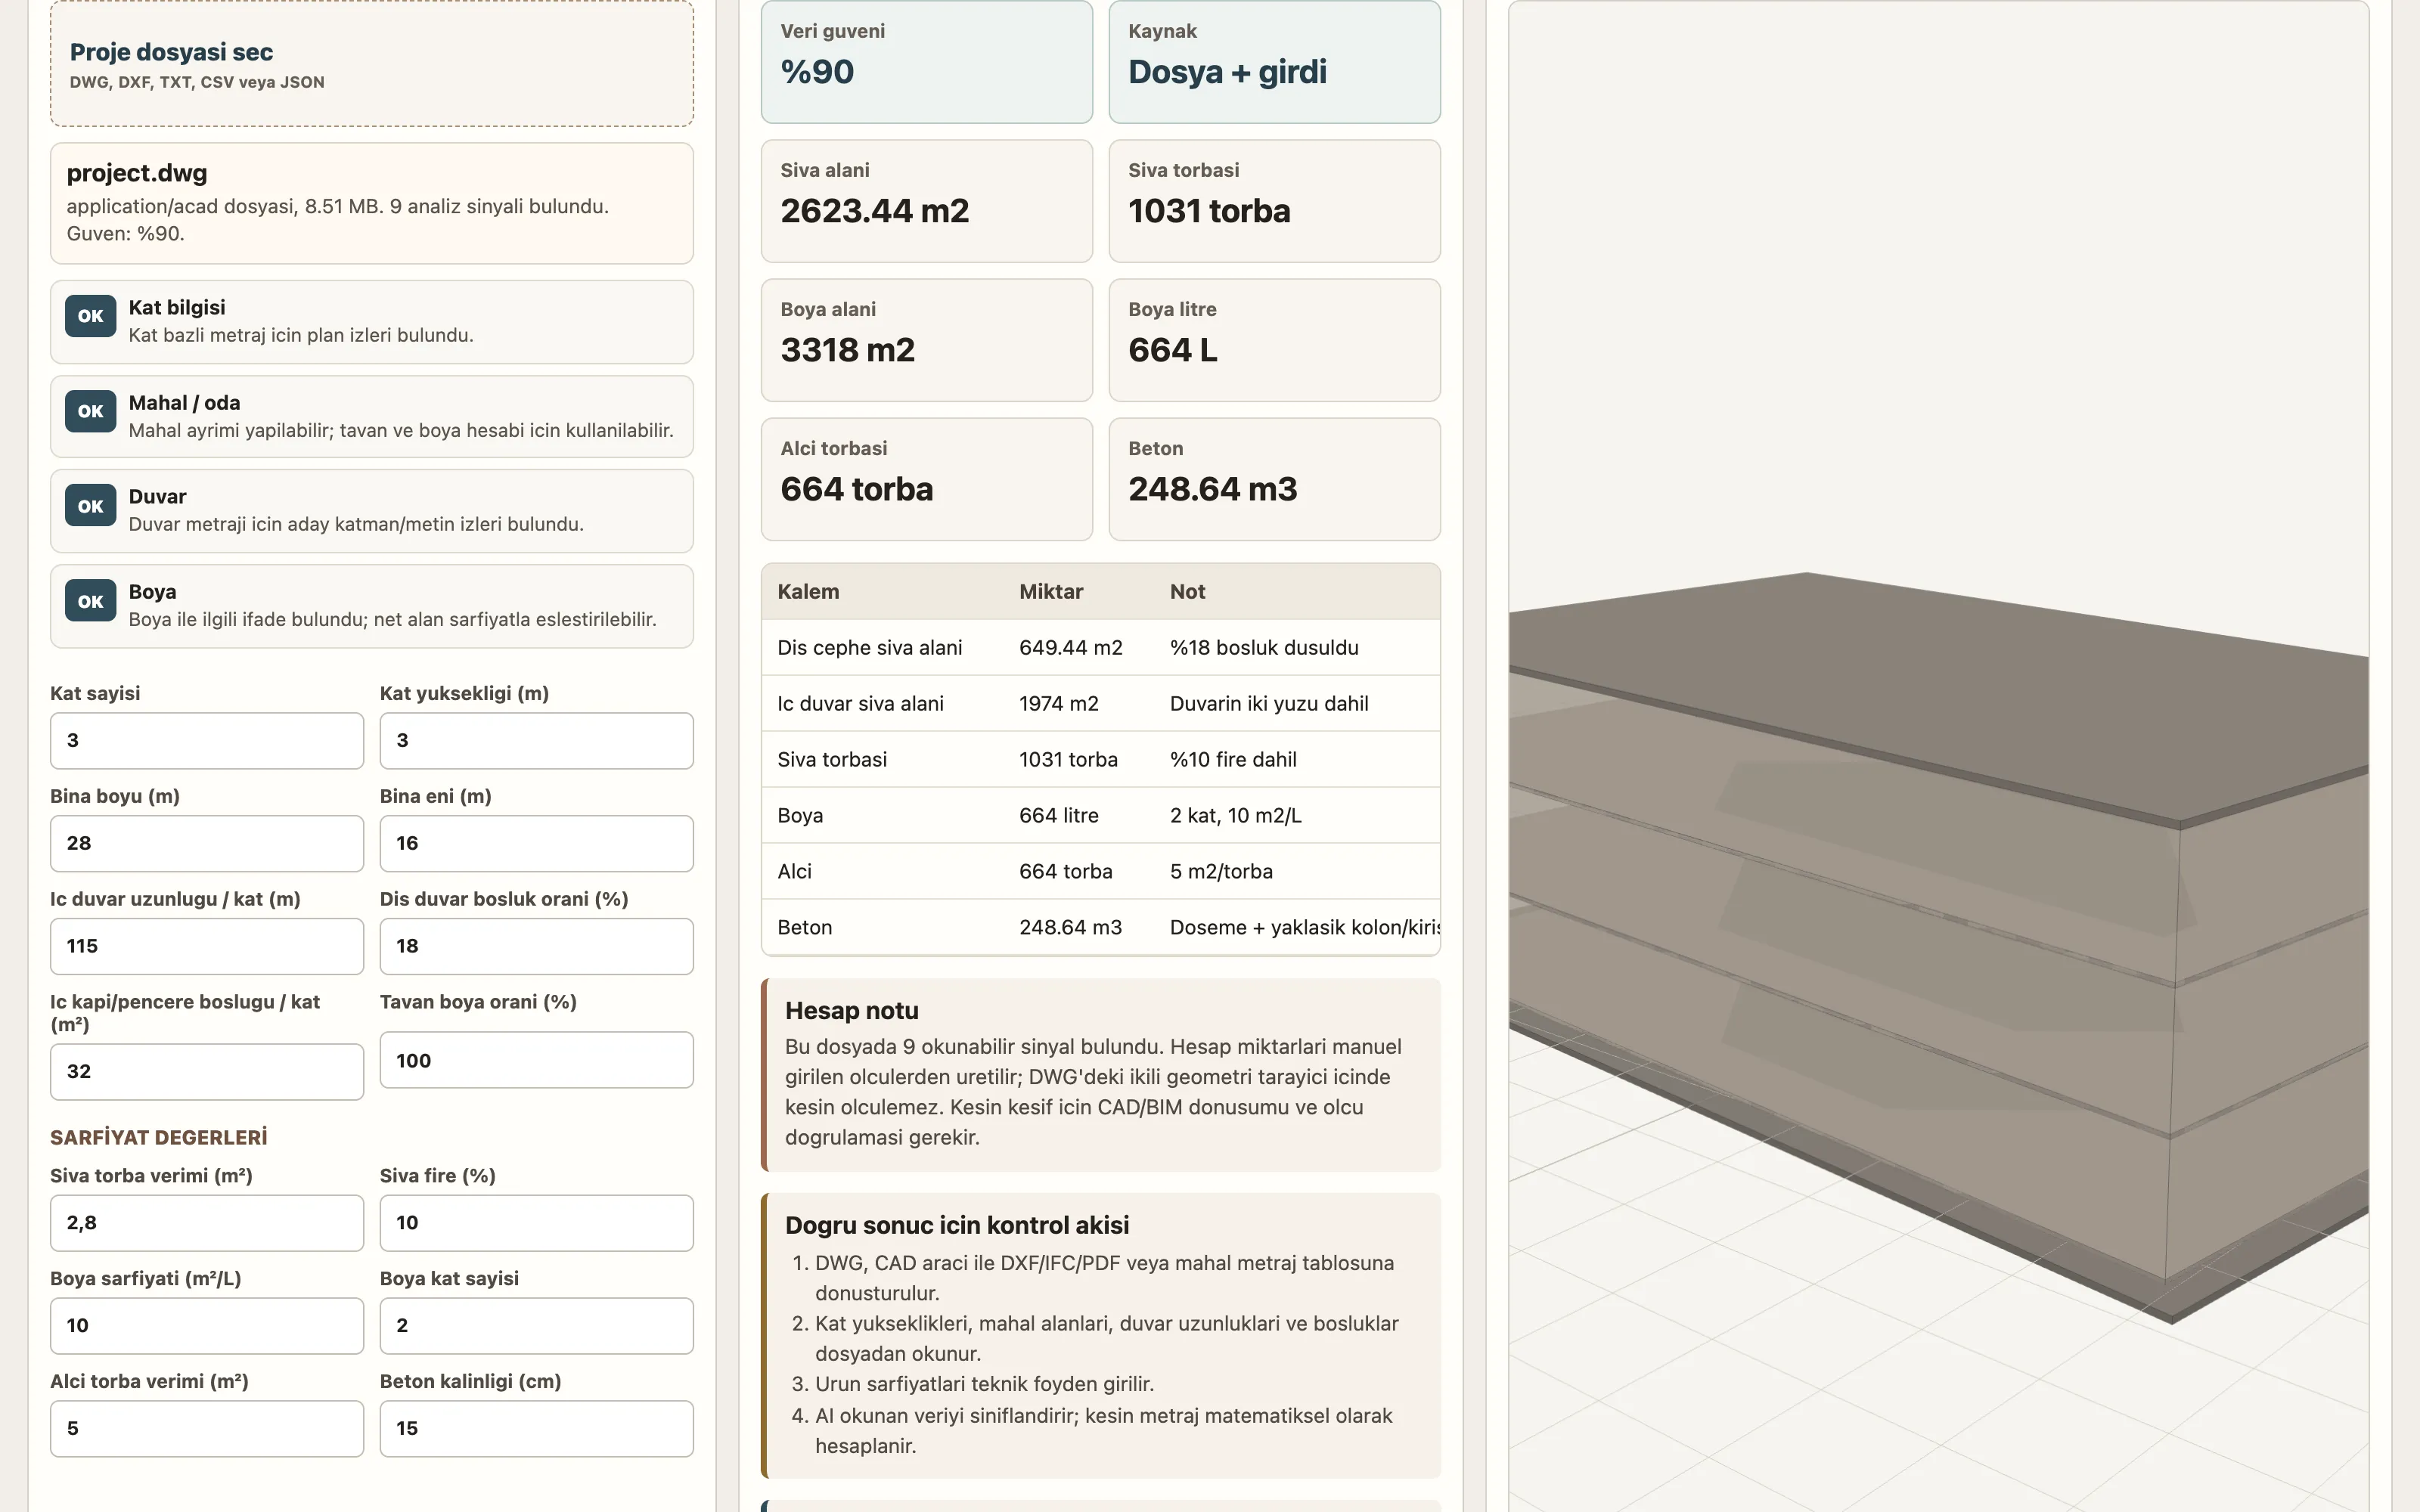
The first layer is the browser-based quantity take-off tool: it looks for 10 types of analysis signal in the DWG/DXF file (floor information, room separation, wall traces, paint notes…) and reports the share it finds as a data confidence score — in this drawing 9 signals were found, a score of 90%; the missing plaster and gypsum information is completed from manually entered consumption values. Consumption values — bag yield, waste rate, square metres per litre — are entered from the technical data sheet; plaster, paint, gypsum and concrete quantities are calculated instantly. Results are exported as CSV/JSON; a three.js-based 3D view shows the building volume in massing, floor and wall modes.
The second layer is the room-rule-based bill of quantities report. The 5-page report prepared for the Oltu, Erzurum project includes the 8-level floor and elevation table (verifying the official 12,084.26 m² area against the floor plans), production rules by room type (ceramic tiles up to 1.50 m in wet areas, ceiling paint deducted in rooms with suspended ceilings, and so on), a calculation section with formulas, and a site checklist with official item codes.
The bottom lines of the bill of quantities fed directly into the procurement plan: 14,066 bags of base plaster, 4,161 bags of satin gypsum, 8,322 litres of interior paint and 4,920 m³ of ready-mixed concrete — each reported with its formula and assumptions.
- DWG/DXF binary analysis: format signature, layer and legend text scanning
- 10-signal data confidence score — what the file does and does not say is explicit
- Parametric calculation engine: wall density, waste and yield values are editable
- 3D massing view with three.js: massing, floors and wall modes
- CSV/JSON bill of quantities output — direct transfer to the procurement list
- Room-rule-based bill of quantities report: floor and elevation table, production rules, item codes
- Site checklist: points to verify before application
Flow — real screens
05 — In production
The tool and the report pipeline were used in the preliminary bill of quantities for the dormitory and administrative building project in Oltu, Erzurum; the resulting quantities became the basis of procurement planning.
12,084
m² of project area applied to
4,920
m³ concrete estimate — formula in the report
14,066
Bags of plaster calculated, including 10% waste